Aortic Arch Coarctation Surgical Outcomes

An aortic arch coarctation (CoA) is a type of congenital heart defect in which the blood vessel that brings fresh blood from the heart to the body is narrowed and disrupts blood flow to the body.
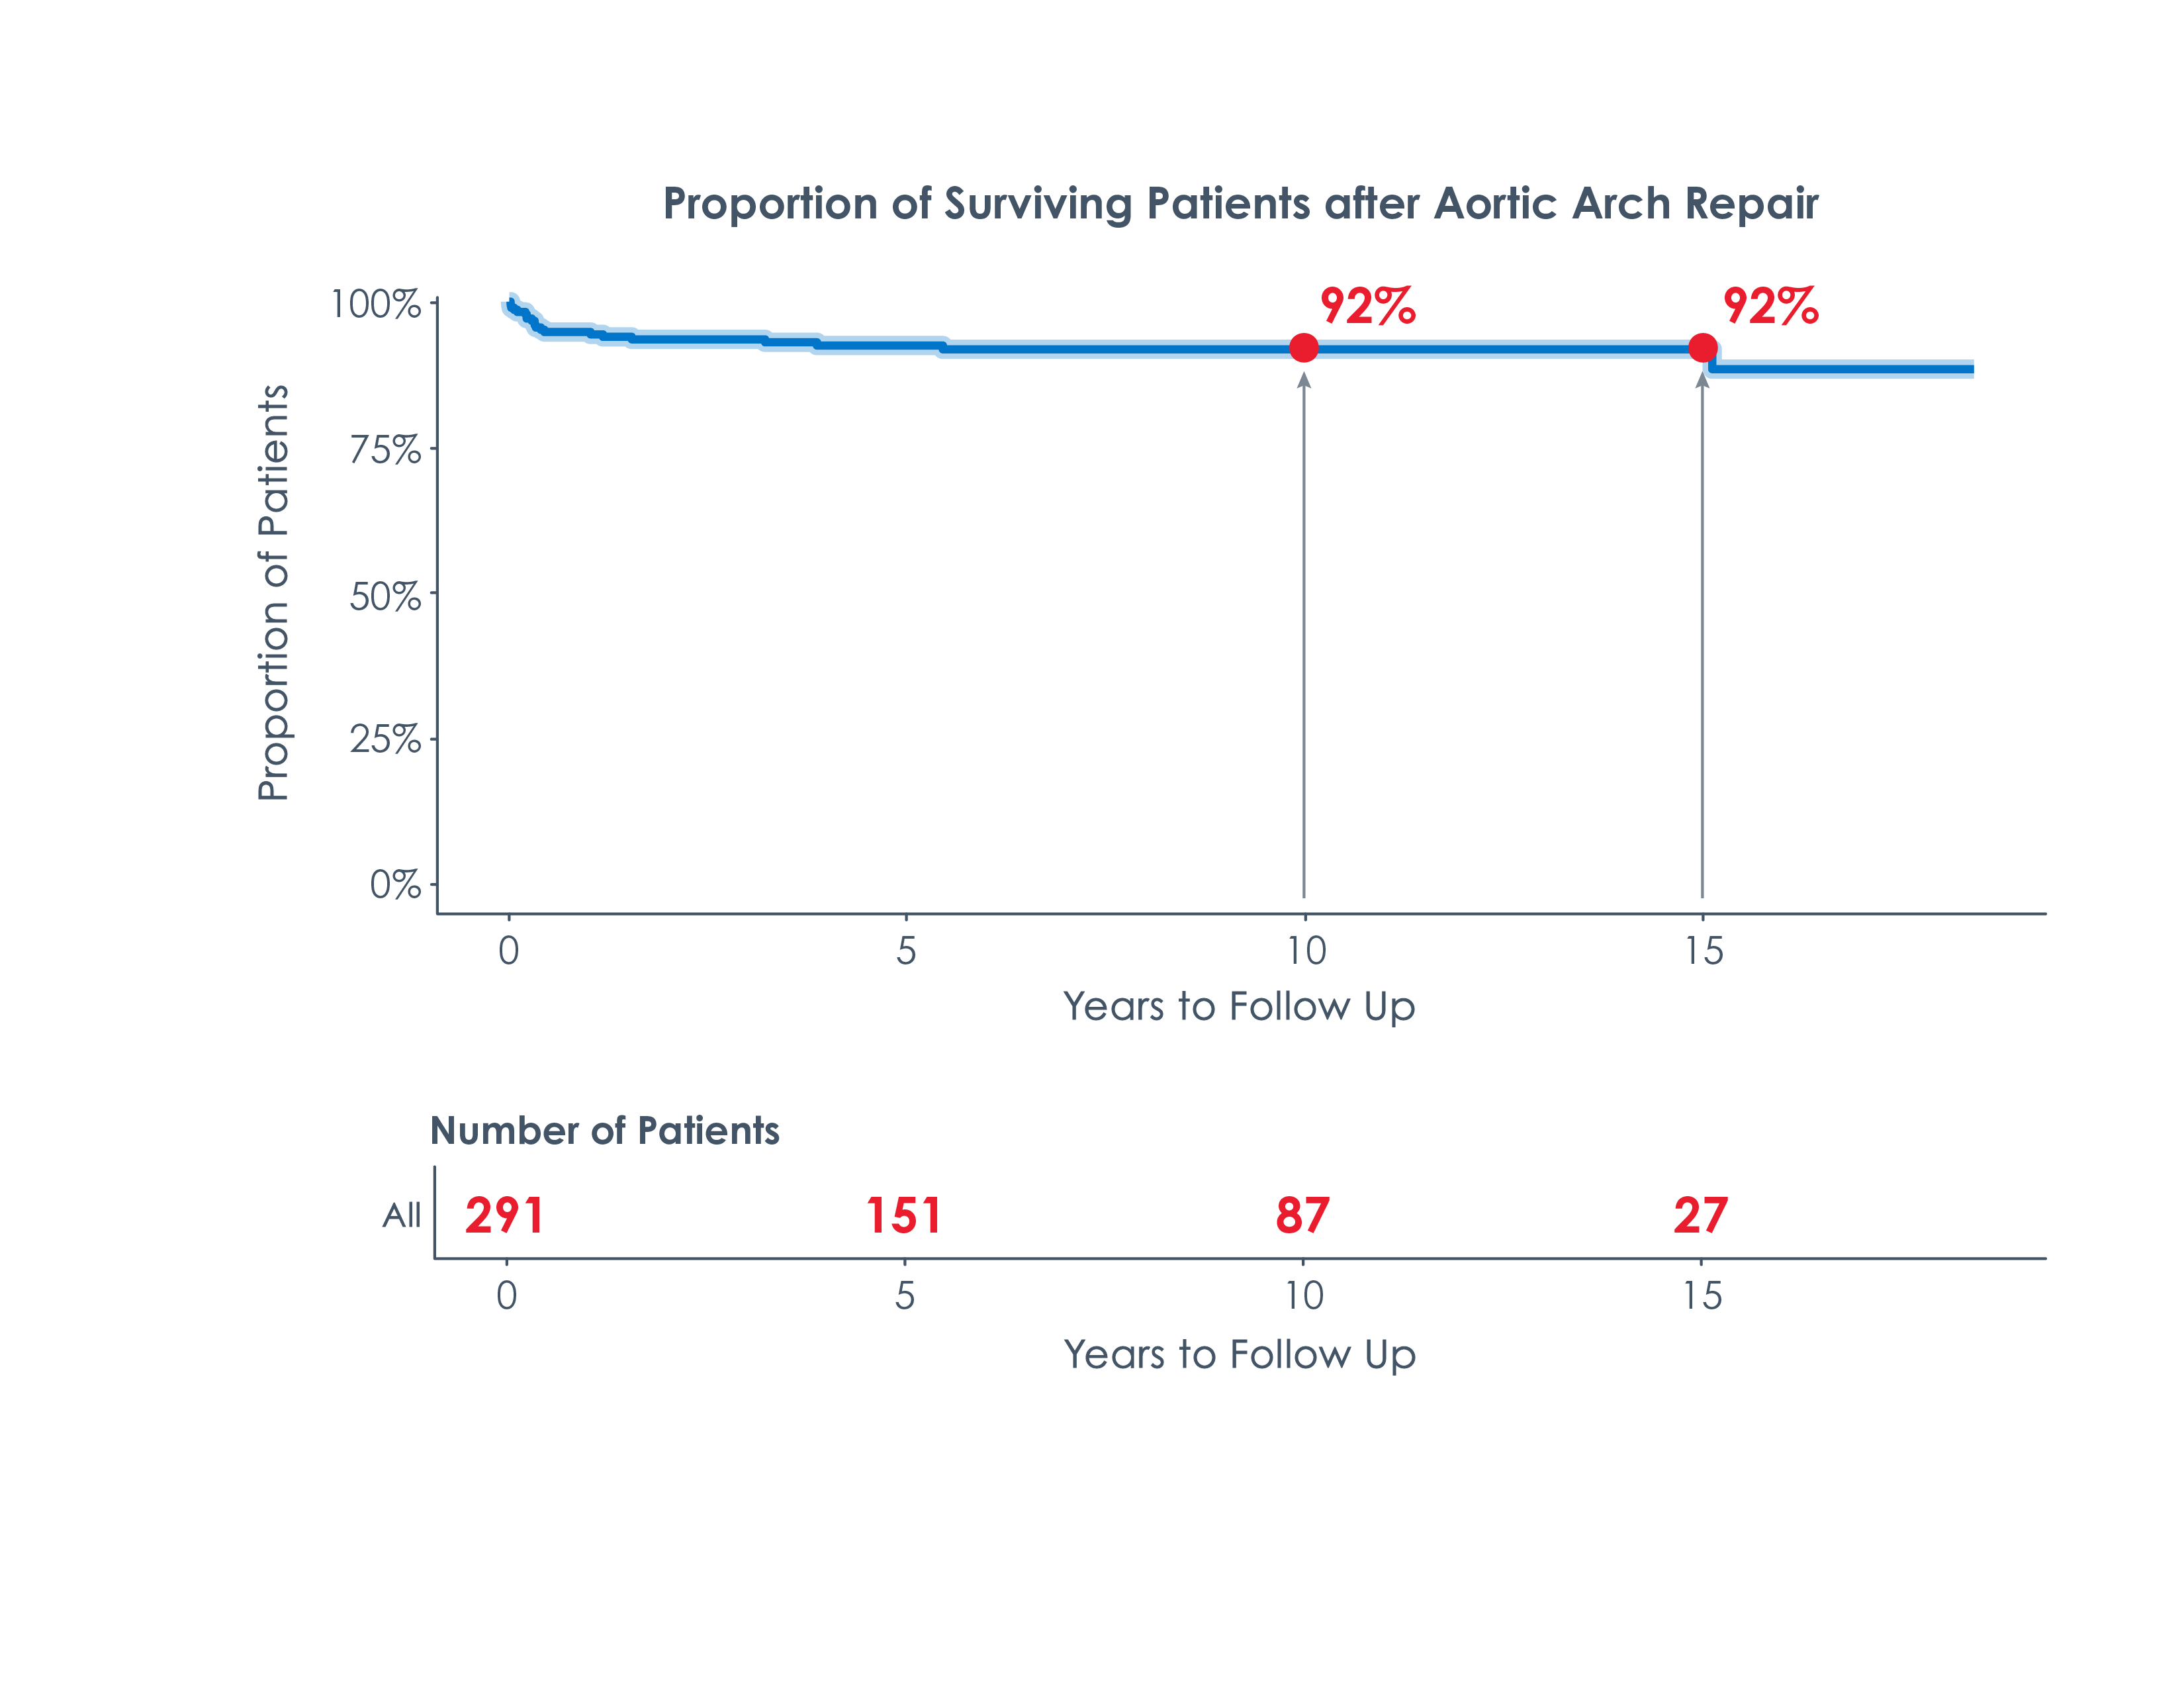
Long-Term Survival Outcomes After Aortic Arch Coarctation Surgery
Twenty-year survival rates after coarctation repair can be up to around 94%.
This graph shows long-term survival rate after someone receives an aortic arch coarctation repair.
The arrows at different time periods show that:
- An estimated 92% of people with an aortic arch coarctation repair survive 10 to 15 years.
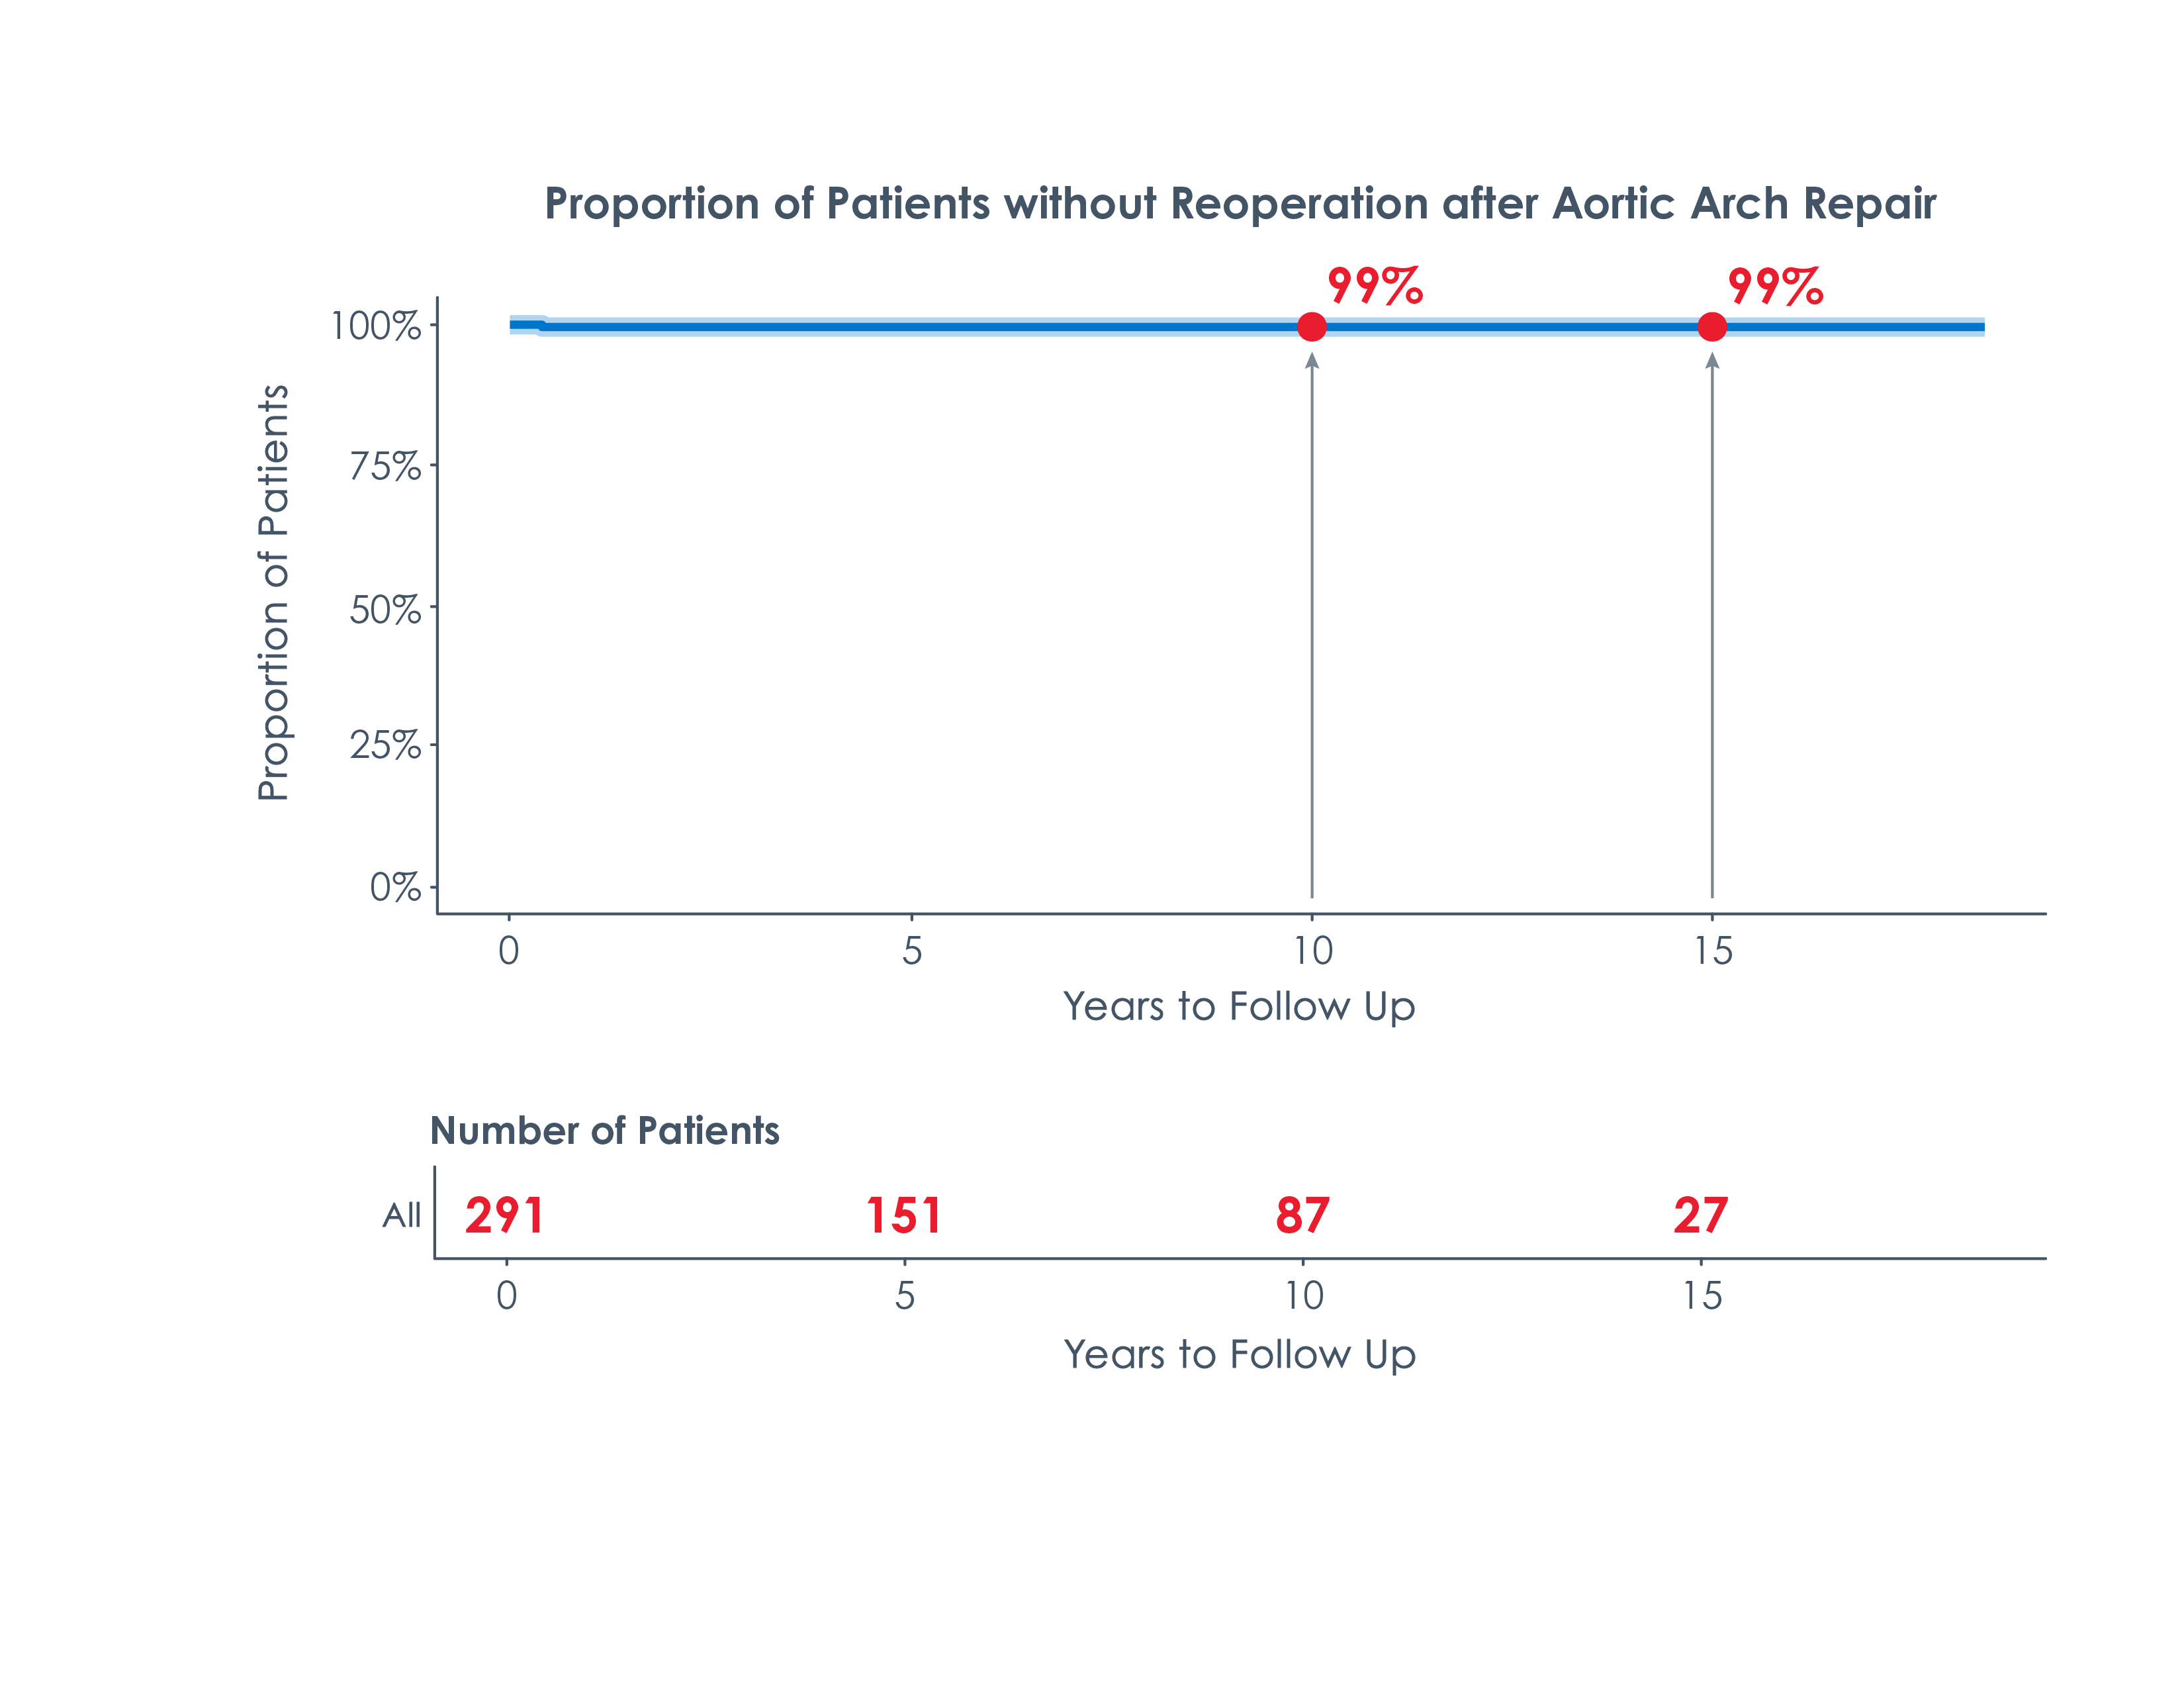
Risk of Reoperation for Aortic Arch Coarctation
Sometimes, the recurrence of coarctation may require an additional surgery (reoperation).
This graph shows the chances of needing reoperation after receiving an aortic arch coarctation repair.
The arrows at different time periods show that:
- An estimated 99.6% of people with an aortic arch coarctation repair will not need a reoperation 10 to 15 years after repair.
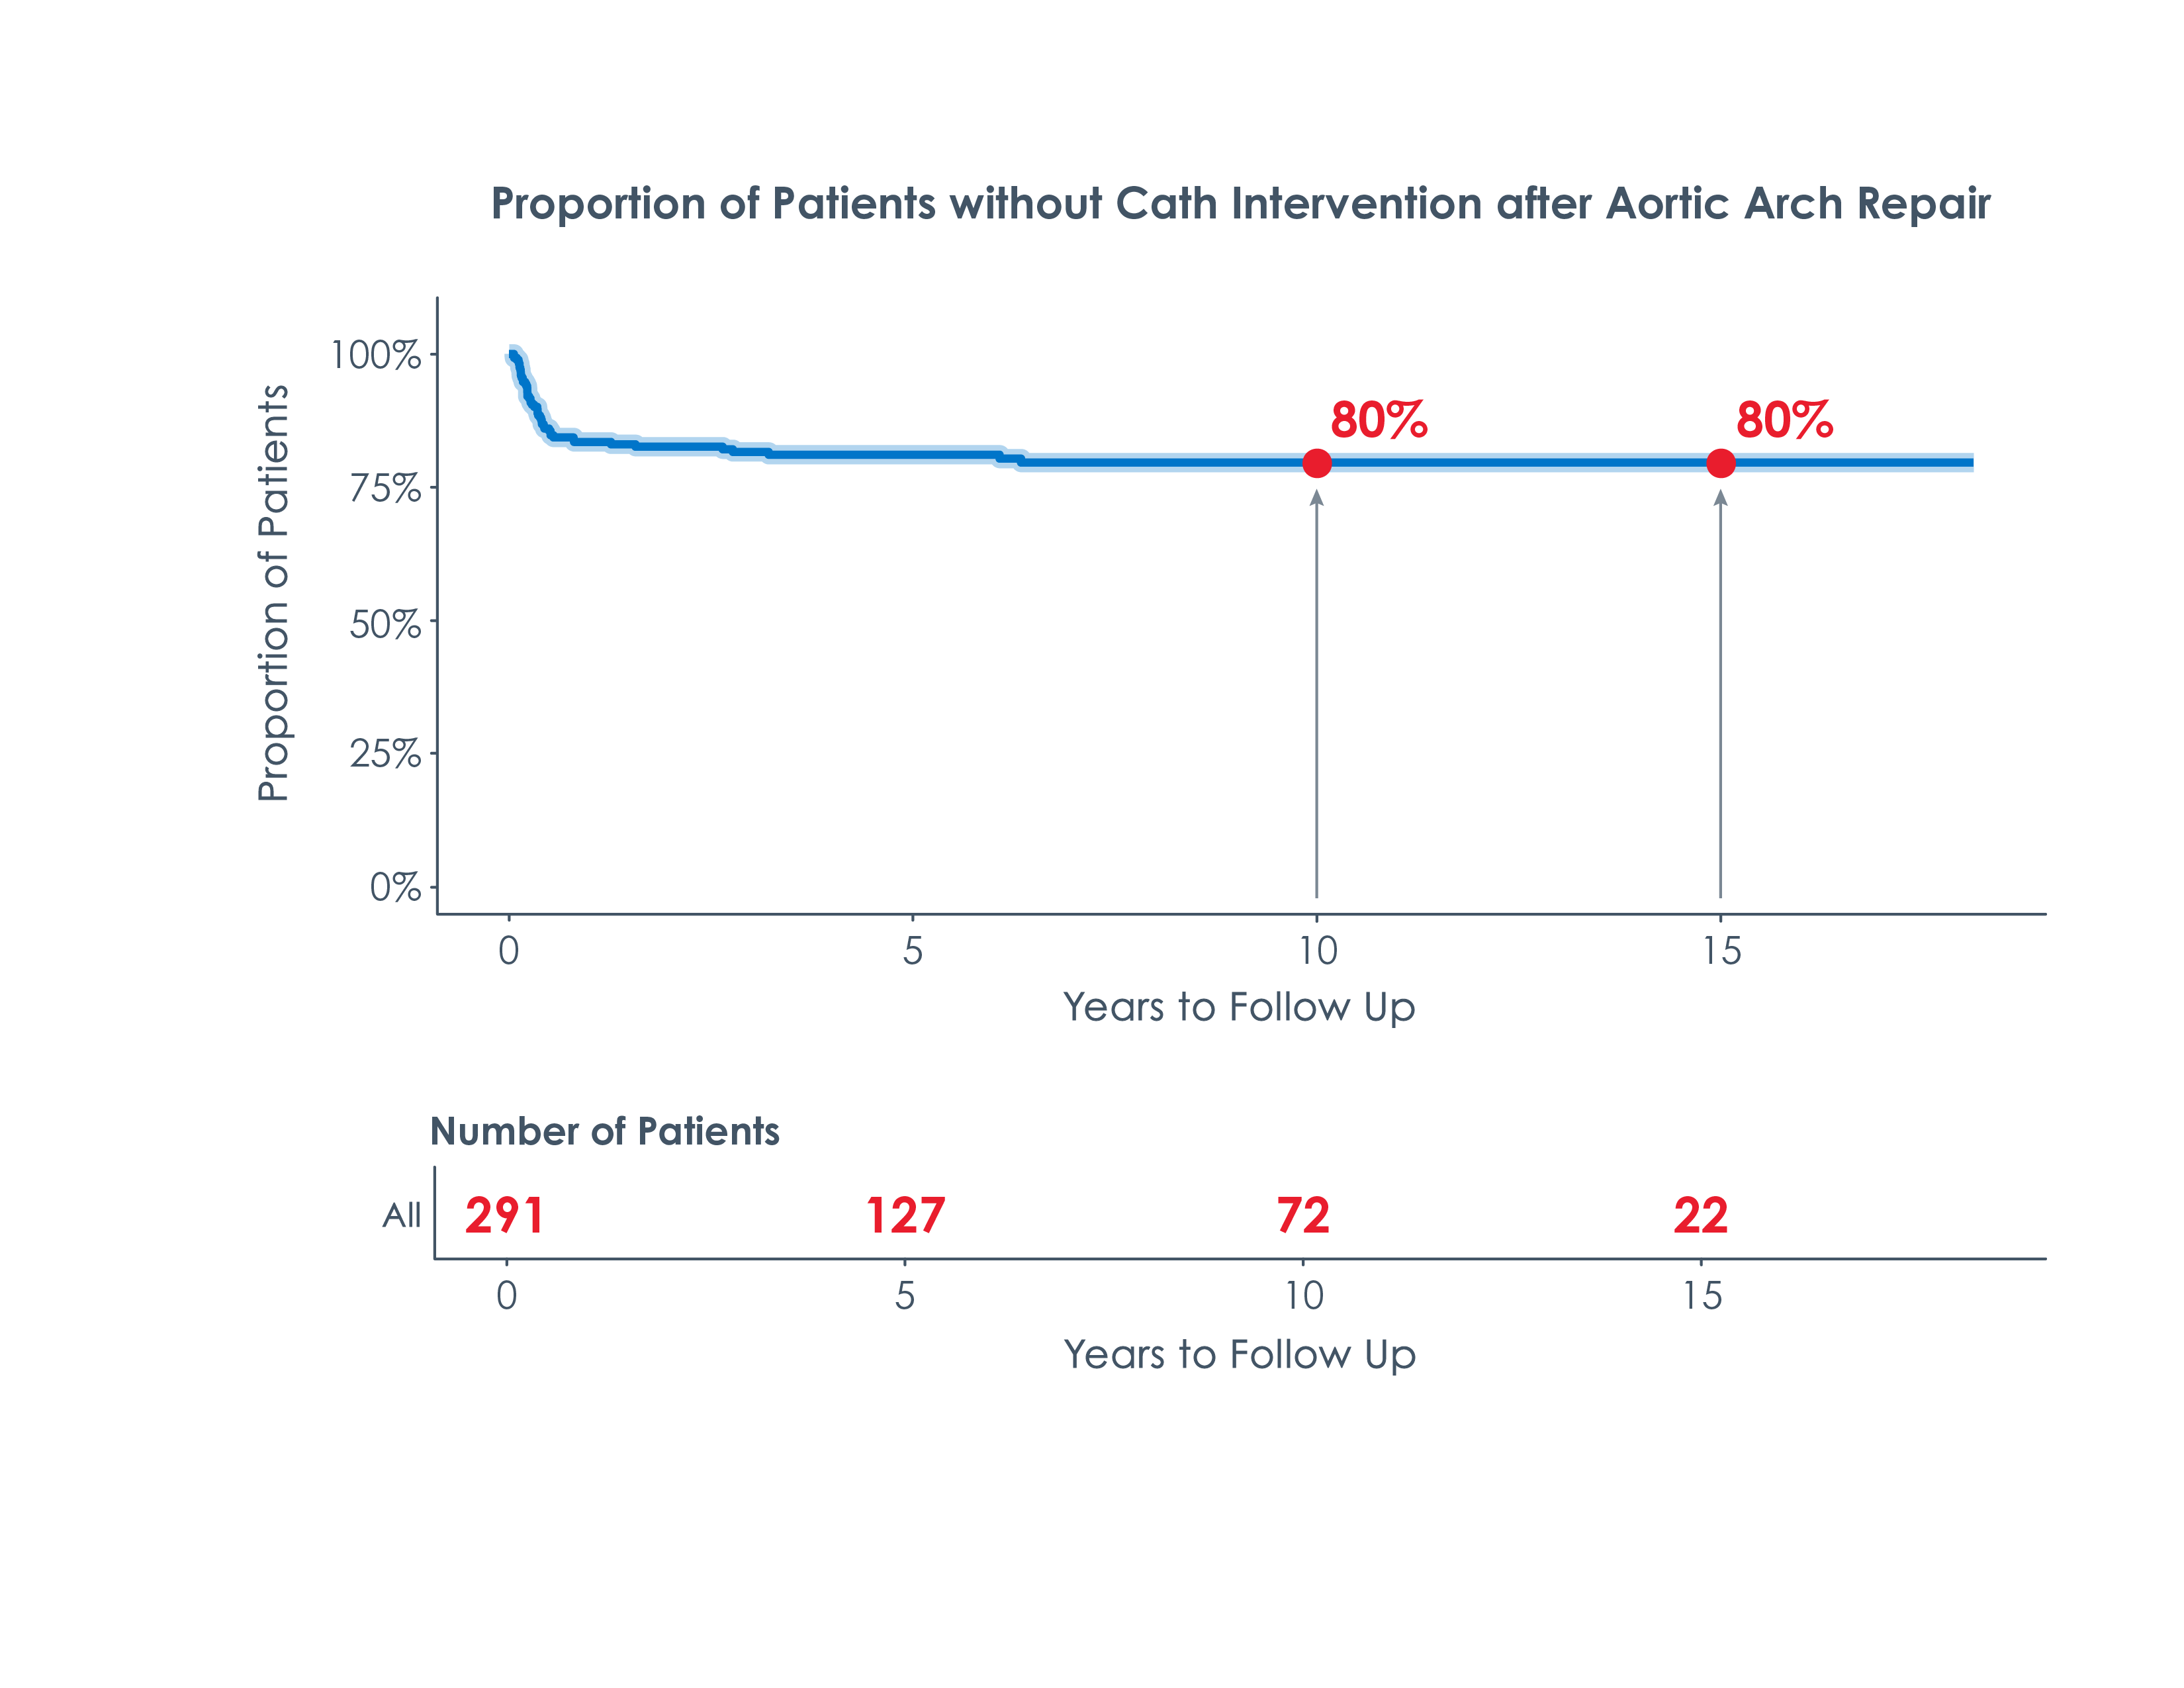
Risk of Cardiac Catheterization for Aortic Arch Coarctation
Aortic arch coarctation repair aims to enlarge the aorta when it is abnormally tight. Occasionally, a recurrence of this coarctation may occur and require a reintervention. These instances can typically be fixed with a catheter re-intervention. This graph shows the chances of needing catheter-based re-intervention after a repair for aortic arch coarctation.
The arrows at different time periods show that:
- An estimated 80% of people who had an aortic arch coarctation repair will not need a reintervention 10 to 15 years after repair.
How to Read and Interpret These Numbers
These graphs are called Kaplan Meier curves. They are produced using our own cardiac surgery data that is stored in the CNCORe database. The goal of these graphs is to predict what may happen 10 to 15 years after a child's initial heart surgery. We collect data and information for every single patient we have operated on. Over time, however, some people stop seeing their doctor or move to different states and countries—meaning that researchers do not have complete information for every patient across the years.
The CNCORe data is used to create graphs that estimate risk for something like reoperation using the data we do have, without needing every data point for every single patient.
Understanding the Line Graphs
Cardiac Surgery Long-Term Outcome Graphs
For each heart condition below, you can view data about the risks of surgical procedures and the chances of a child needing additional operations over time.